This notebook illustrates the use of the new Assistants API (GPT-4), and DALL·E-3 in crafting informative and visually appealing slides.
Creating slides is a pivotal aspect of many jobs, but can be laborious and time-consuming. Additionally, extracting insights from data and articulating them effectively on slides can be challenging.
This cookbook recipe will demonstrate how you can utilize the new Assistants API to facilitate the end to end slide creation process for you without you having to touch Microsoft PowerPoint or Google Slides, saving you valuable time and effort!
0. Setup
from IPython.display import display, Image
from openai import OpenAI
import os
import pandas as pd
import json
import io
from PIL import Image
import requests

client = OpenAI(api_key=os.environ.get("OPENAI_API_KEY", "<your OpenAI API key if not set as env var>"))

#Lets import some helper functions for assistants from https://cookbook.openai.com/examples/assistants_api_overview_python
def show_json(obj):
    display(json.loads(obj.model_dump_json()))

def submit_message(assistant_id, thread, user_message,file_ids=None):
    params = {
        'thread_id': thread.id,
        'role': 'user',
        'content': user_message,
    }
    if file_ids:
        params['file_ids']=file_ids

    client.beta.threads.messages.create(
        **params
)
    return client.beta.threads.runs.create(
    thread_id=thread.id,
    assistant_id=assistant_id,
)

def get_response(thread):
    return client.beta.threads.messages.list(thread_id=thread.id)
1. Creating the content
In this recipe, we will be creating a brief fictional presentation for the quarterly financial review of our company, NotReal Corporation. We want to highlight some key trends we are seeing that are affecting the profitability of our company.
Let's say we have the some financial data at our disposal. Let's load in the data, and take a look...
financial_data_path = 'data/NotRealCorp_financial_data.json'
financial_data = pd.read_json(financial_data_path)
financial_data.head(5)
| Year | Quarter | Distribution channel | Revenue ($M) | Costs ($M) | Customer count | Time | |
|---|---|---|---|---|---|---|---|
| 0 | 2021 | Q1 | Online Sales | 1.50 | 1.301953 | 150 | 2021 Q1 |
| 1 | 2021 | Q1 | Direct Sales | 1.50 | 1.380809 | 151 | 2021 Q1 |
| 2 | 2021 | Q1 | Retail Partners | 1.50 | 1.348246 | 152 | 2021 Q1 |
| 3 | 2021 | Q2 | Online Sales | 1.52 | 1.308608 | 152 | 2021 Q2 |
| 4 | 2021 | Q2 | Direct Sales | 1.52 | 1.413305 | 153 | 2021 Q2 |
As you can see, this data has quarterly revenue, costs and customer data across different distribution channels. Let's create an Assistant that can act as a personal analyst and make a nice visualization for our PowerPoint!
First, we need to upload our file so our Assistant can access it.
file = client.files.create(
  file=open('data/NotRealCorp_financial_data.json',"rb"),
  purpose='assistants',
)
Now, we're ready to create our Assistant. We can instruct our assistant to act as a data scientist, and take any queries we give it and run the necessary code to output the proper data visualization. The instructions parameter here is akin to system instructions in the ChatCompletions endpoint, and can help guide the assistant. We can also turn on the tool of Code Interpreter, so our Assistant will be able to code. Finally, we can specifiy any files we want to use, which in this case is just the financial_data file we created above.
assistant = client.beta.assistants.create(
  instructions="You are a data scientist assistant. When given data and a query, write the proper code and create the proper visualization",
  model="gpt-4-1106-preview",
  tools=[{"type": "code_interpreter"}],
  file_ids=[file.id]
)
Let's create a thread now, and as our first request ask the Assistant to calculate quarterly profits, and then plot the profits by distribution channel over time. The assistant will automatically calculate the profit for each quarter, and also create a new column combining quarter and year, without us having to ask for that directly. We can also specify the colors of each line.
thread = client.beta.threads.create(
  messages=[
    {
      "role": "user",
      "content": "Calculate profit (revenue minus cost) by quarter and year, and visualize as a line plot across the distribution channels, where the colors of the lines are green, light red, and light blue",
      "file_ids": [file.id]
    }
  ]
)
No we can execute the run of our thread
run = client.beta.threads.runs.create(
    thread_id=thread.id,
    assistant_id=assistant.id,
)
We can now start a loop that will check if the image has been created. Note: This may take a few minutes
messages = client.beta.threads.messages.list(thread_id=thread.id)
import time

while True:
    messages = client.beta.threads.messages.list(thread_id=thread.id)
    try:
        #See if image has been created
        messages.data[0].content[0].image_file
        #Sleep to make sure run has completed
        time.sleep(5)
        print('Plot created!')
        break
    except:
        time.sleep(10)
        print('Assistant still working...')
Assistant still working...
Assistant still working...
Assistant still working...
Assistant still working...
Assistant still working...
Assistant still working...
Assistant still working...
Assistant still working...
Assistant still working...
Assistant still working...
Assistant still working...
Assistant still working...
Assistant still working...
Assistant still working...
Assistant still working...
Assistant still working...
Assistant still working...
Plot created!
Let's see the messages the Assistant added.
messages = client.beta.threads.messages.list(thread_id=thread.id)
[message.content[0] for message in messages.data]
[MessageContentImageFile(image_file=ImageFile(file_id='file-0rKABLygI02MgwwhpgWdRFY1'), type='image_file'),
 MessageContentText(text=Text(annotations=[], value="The profit has been calculated for each distribution channel by quarter and year. Next, I'll create a line plot to visualize these profits. As specified, I will use green for the 'Online Sales', light red for 'Direct Sales', and light blue for 'Retail Partners' channels. Let's create the plot."), type='text'),
 MessageContentText(text=Text(annotations=[], value="The JSON data has been successfully restructured into a tabular dataframe format. It includes the year, quarter, distribution channel, revenue, costs, customer count, and a combined 'Time' representation of 'Year Quarter'. Now, we have the necessary information to calculate the profit (revenue minus cost) by quarter and year.\n\nTo visualize the profit across the different distribution channels with a line plot, we will proceed with the following steps:\n\n1. Calculate the profit for each row in the dataframe.\n2. Group the data by 'Time' (which is a combination of Year and Quarter) and 'Distribution channel'.\n3. Aggregate the profit for each group.\n4. Plot the aggregated profits as a line plot with the distribution channels represented in different colors as requested.\n\nLet's calculate the profit for each row and then continue with the visualization."), type='text'),
 MessageContentText(text=Text(annotations=[], value='The structure of the JSON data shows that it is a dictionary with "Year", "Quarter", "Distribution channel", and potentially other keys that map to dictionaries containing the data. The keys of the inner dictionaries are indices, indicating that the data is tabular but has been converted into a JSON object.\n\nTo properly convert this data into a DataFrame, I will restructure the JSON data into a more typical list of dictionaries, where each dictionary represents a row in our target DataFrame. Subsequent to this restructuring, I can then load the data into a Pandas DataFrame. Let\'s restructure and load the data.'), type='text'),
 MessageContentText(text=Text(annotations=[], value="The JSON data has been incorrectly loaded into a single-row DataFrame with numerous columns representing each data point. This implies the JSON structure is not as straightforward as expected, and a direct conversion to a flat table is not possible without further processing.\n\nTo better understand the JSON structure and figure out how to properly normalize it into a table format, I will print out the raw JSON data structure. We will analyze its format and then determine the correct approach to extract the profit by quarter and year, as well as the distribution channel information. Let's take a look at the JSON structure."), type='text'),
 MessageContentText(text=Text(annotations=[], value="It seems that the file content was successfully parsed as JSON, and thus, there was no exception raised. The variable `error_message` is not defined because the `except` block was not executed.\n\nI'll proceed with displaying the data that was parsed from JSON."), type='text'),
 MessageContentText(text=Text(annotations=[], value="It appears that the content of the dataframe has been incorrectly parsed, resulting in an empty dataframe with a very long column name that seems to contain JSON data rather than typical CSV columns and rows.\n\nTo address this issue, I will take a different approach to reading the file. I will attempt to parse the content as JSON. If this is not successful, I'll adjust the loading strategy accordingly. Let's try to read the contents as JSON data first."), type='text'),
 MessageContentText(text=Text(annotations=[], value="Before we can calculate profits and visualize the data as requested, I need to first examine the contents of the file that you have uploaded. Let's go ahead and read the file to understand its structure and the kind of data it contains. Once I have a clearer picture of the dataset, we can proceed with the profit calculations. I'll begin by loading the file into a dataframe and displaying the first few entries to see the data schema."), type='text'),
 MessageContentText(text=Text(annotations=[], value='Calculate profit (revenue minus cost) by quarter and year, and visualize as a line plot across the distribution channels, where the colors of the lines are green, light red, and light blue'), type='text')]
We can see that the last message (latest message is shown first) from the assistant contains the image file we are looking for. An interesting note here is that the Assistant was able to attempt several times to parse the JSON data, as the first parsing was unsuccessful, demonstrating the assistant's adaptability.
# Quick helper function to convert our output file to a png
def convert_file_to_png(file_id, write_path):
    data = client.files.content(file_id)
    data_bytes = data.read()
    with open(write_path, "wb") as file:
        file.write(data_bytes)
plot_file_id = messages.data[0].content[0].image_file.file_id
image_path = "../images/NotRealCorp_chart.png"
convert_file_to_png(plot_file_id,image_path)

#Upload
plot_file = client.files.create(
  file=open(image_path, "rb"),
  purpose='assistants'
)
Let's load in the plot!
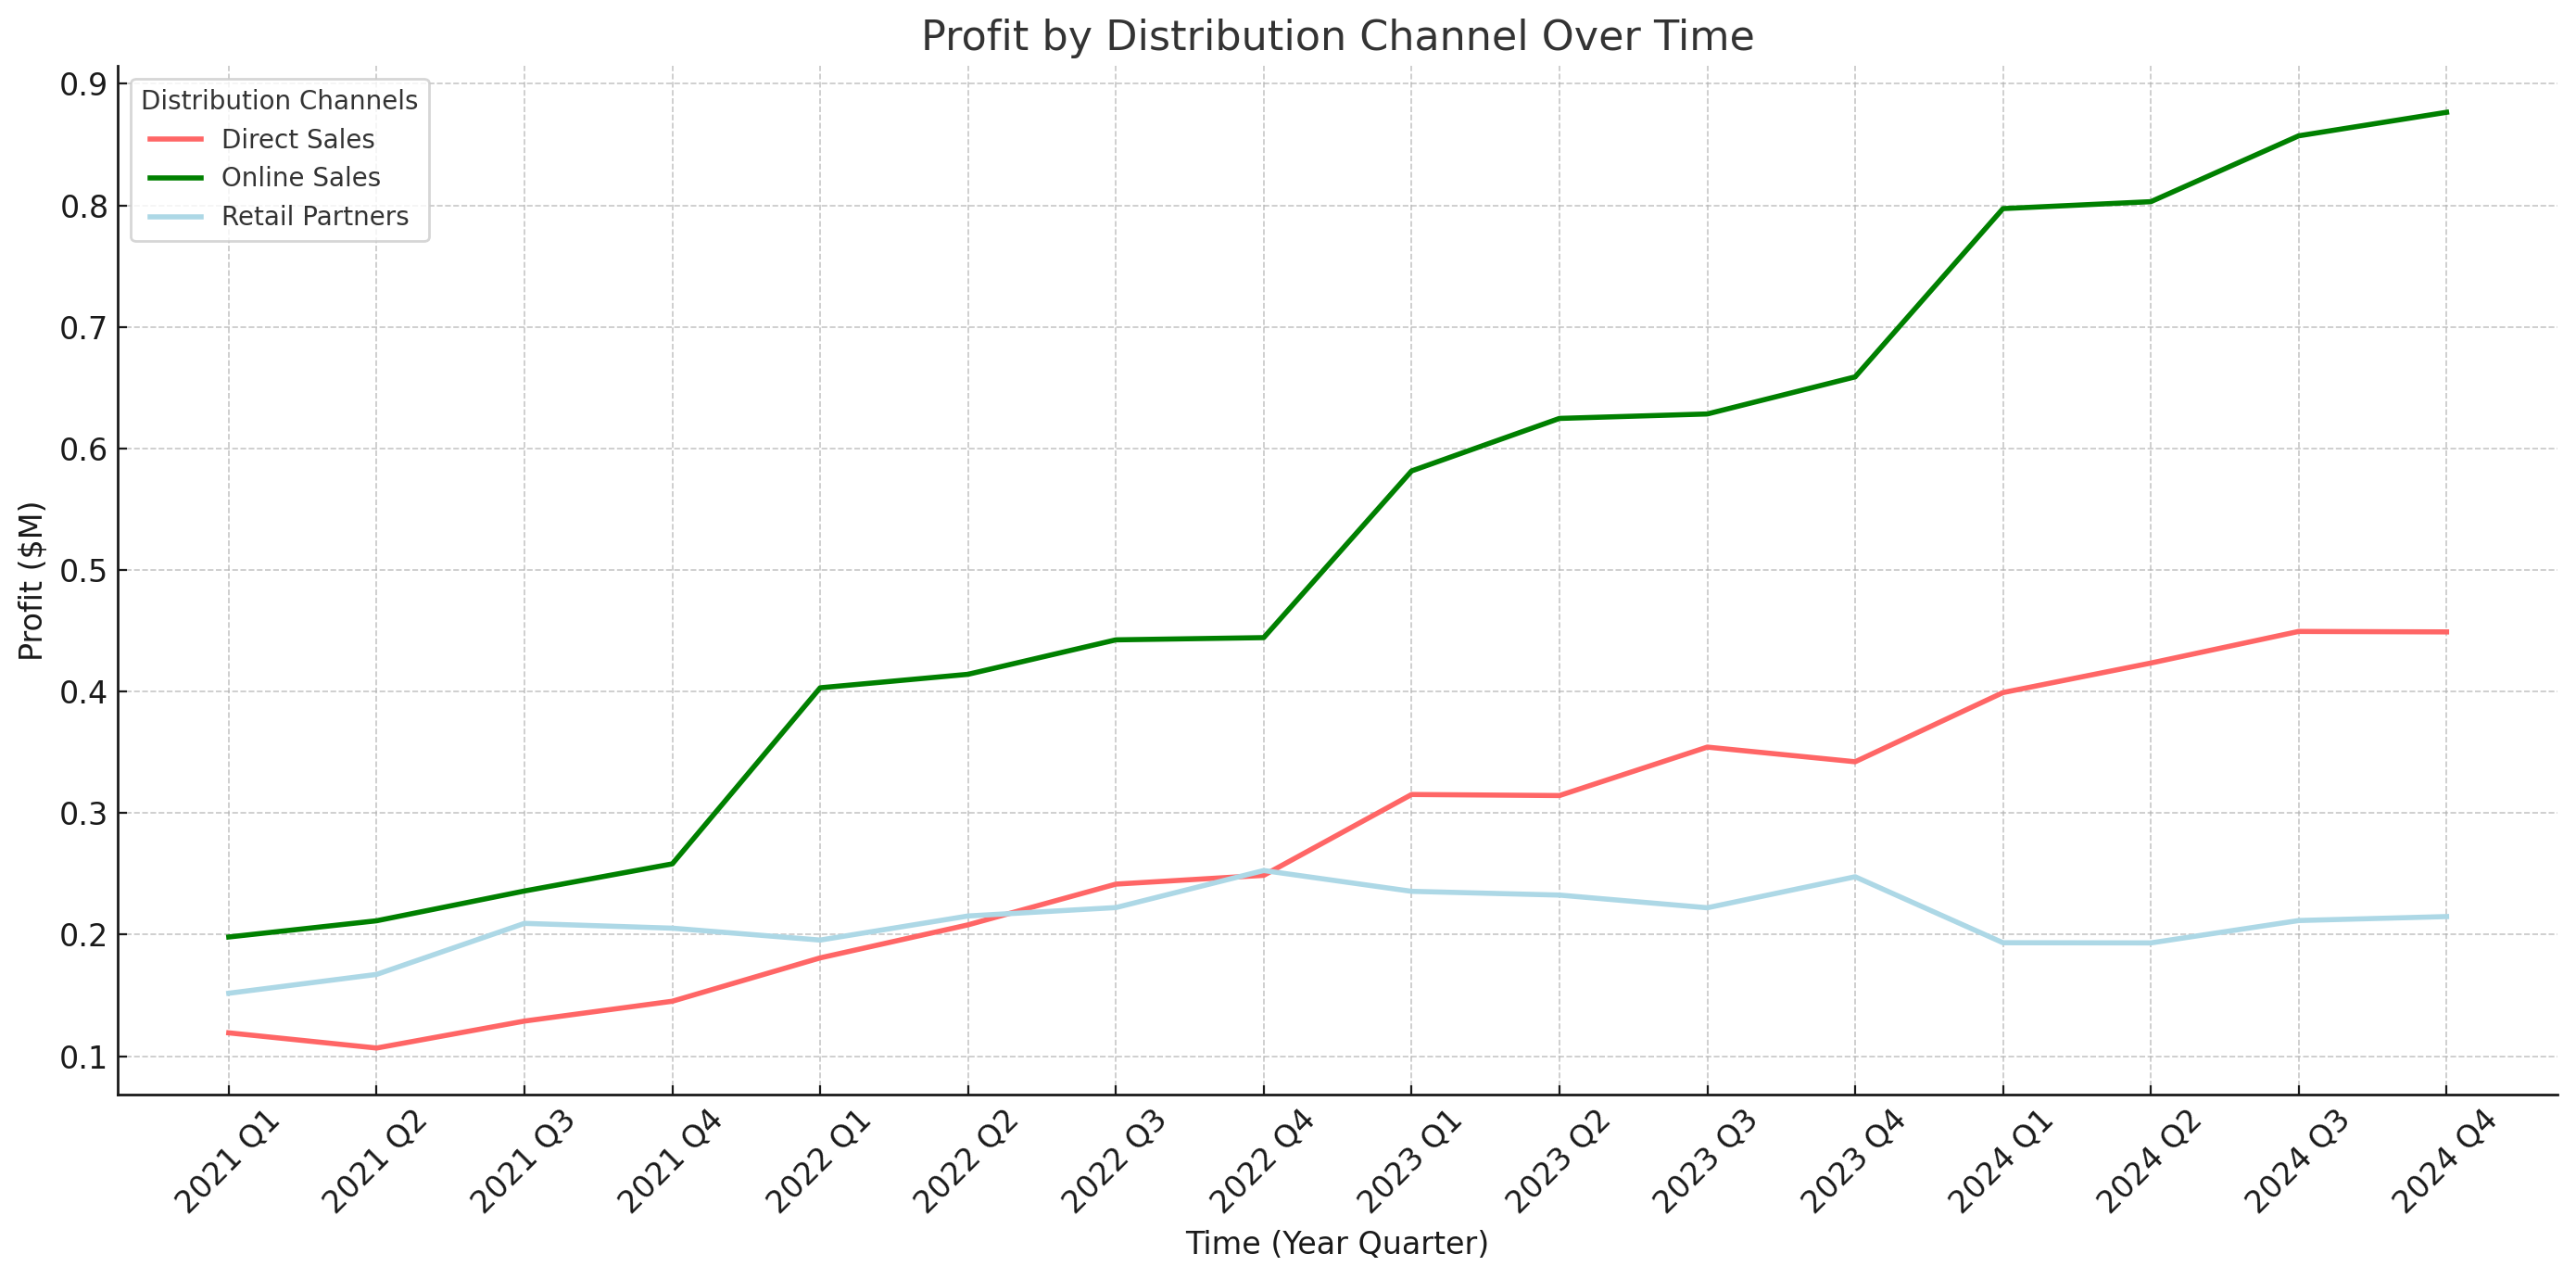
Nice! So, with just one sentence, we were able to have our assistant use code interpreter to
calculate the profitability, and graph the three lineplots of the various distribution channels.
Now we have a nice visual for our slide, but we want some insights to go along with it.
2. Generating insights
To get insights from our image, we simply need to add a new message to our thread. Our Assistant will know to use the message history to give us some concise takeaways from the visual provided.
submit_message(assistant.id,thread,"Give me two medium length sentences (~20-30 words per sentence) of the \
      most important insights from the plot you just created.\
             These will be used for a slide deck, and they should be about the\
                     'so what' behind the data."
)
Run(id='run_NWoygMcBfHUr58fCE4Cn6rxN', assistant_id='asst_3T362kLlTyAq0FUnkvjjQczO', cancelled_at=None, completed_at=None, created_at=1701827074, expires_at=1701827674, failed_at=None, file_ids=['file-piTokyHGllwGITzIpoG8dok3'], instructions='You are a data scientist assistant. When given data and a query, write the proper code and create the proper visualization', last_error=None, metadata={}, model='gpt-4-1106-preview', object='thread.run', required_action=None, started_at=None, status='queued', thread_id='thread_73TgtFoJMlEJvb13ngjTnAo3', tools=[ToolAssistantToolsCode(type='code_interpreter')])Now, once the run has completed, we can see the latest message
# Hard coded wait for a response, as the assistant may iterate on the bullets.
time.sleep(10)
response = get_response(thread)
bullet_points = response.data[0].content[0].text.value
print(bullet_points)
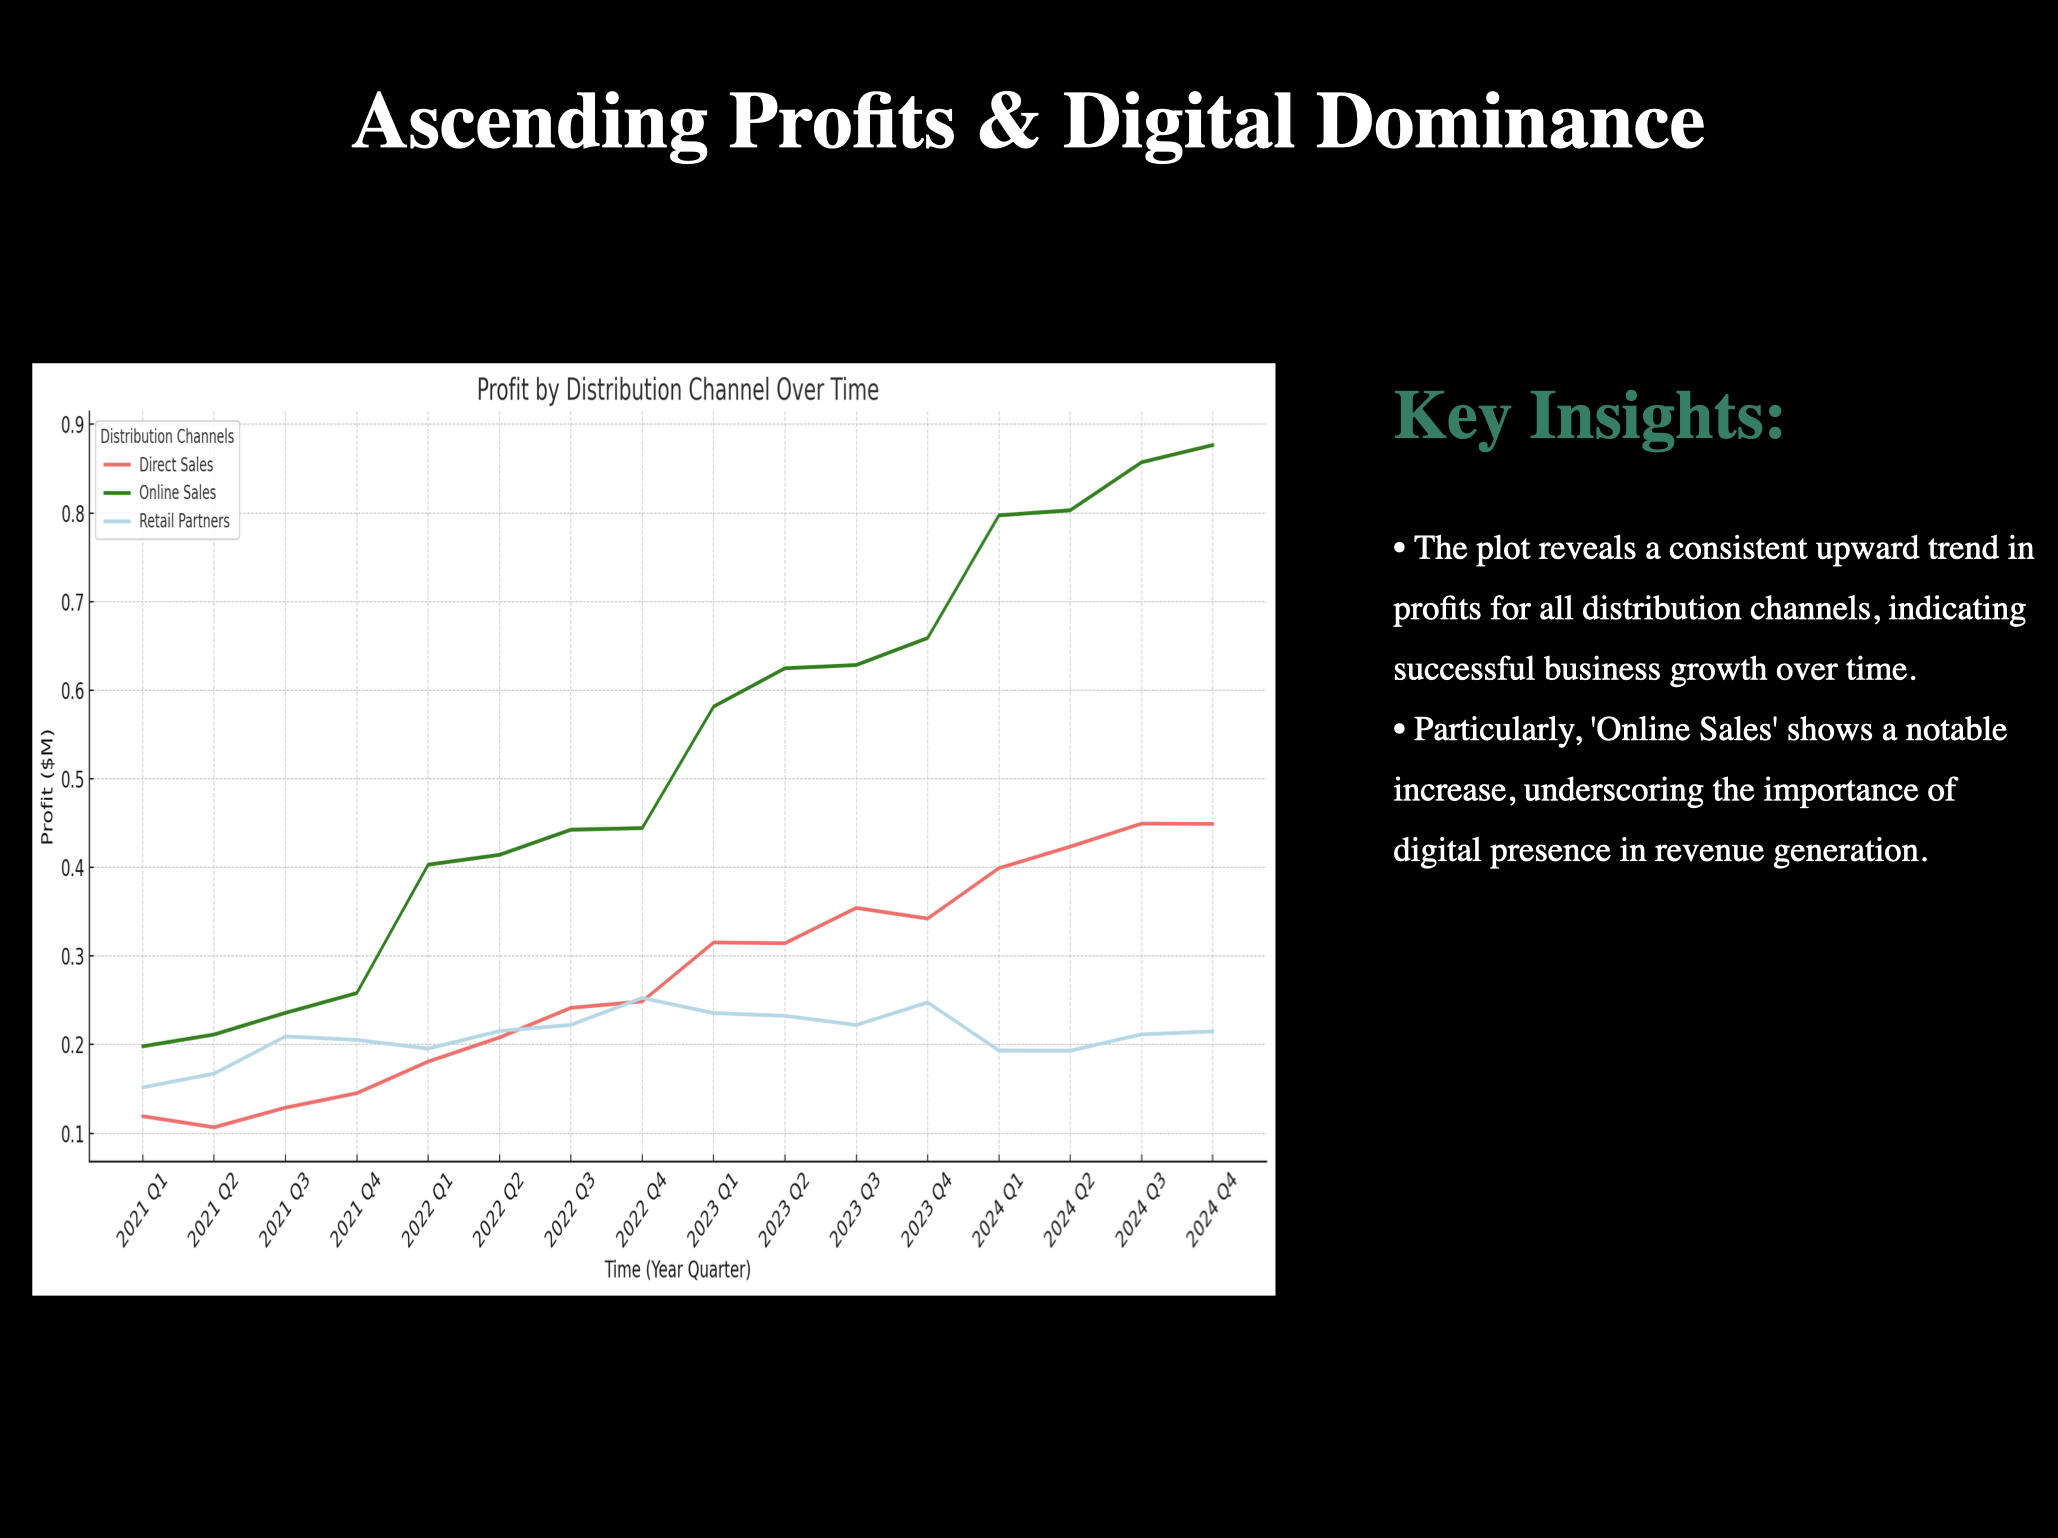
The plot reveals a consistent upward trend in profits for all distribution channels, indicating successful business growth over time. Particularly, 'Online Sales' shows a notable increase, underscoring the importance of digital presence in revenue generation.
Cool! So our assistant was able to identify the noteworthy growth in Online Sales profit, and infer that this shows the importance of a large digital presence. Now let's get a compelling title for the slide.
submit_message(assistant.id,thread,"Given the plot and bullet points you created,\
 come up with a very brief title for a slide. It should reflect just the main insights you came up with."
)
Run(id='run_q6E85J31jCw3QkHpjJKl969P', assistant_id='asst_3T362kLlTyAq0FUnkvjjQczO', cancelled_at=None, completed_at=None, created_at=1701827084, expires_at=1701827684, failed_at=None, file_ids=['file-piTokyHGllwGITzIpoG8dok3'], instructions='You are a data scientist assistant. When given data and a query, write the proper code and create the proper visualization', last_error=None, metadata={}, model='gpt-4-1106-preview', object='thread.run', required_action=None, started_at=None, status='queued', thread_id='thread_73TgtFoJMlEJvb13ngjTnAo3', tools=[ToolAssistantToolsCode(type='code_interpreter')])And the title is:
#Wait as assistant may take a few steps
time.sleep(10)
response = get_response(thread)
title = response.data[0].content[0].text.value
print(title)
"Ascending Profits & Digital Dominance"
3. DALL·E-3 title image
Nice, now we have a title, a plot and two bullet points. We're almost ready to put this all on a slide, but as a final step, let's have DALL·E-3 come up with an image to use as the title slide of the presentation.
Note: DALL·E-3 is not yet available within the assistants API but is coming soon!
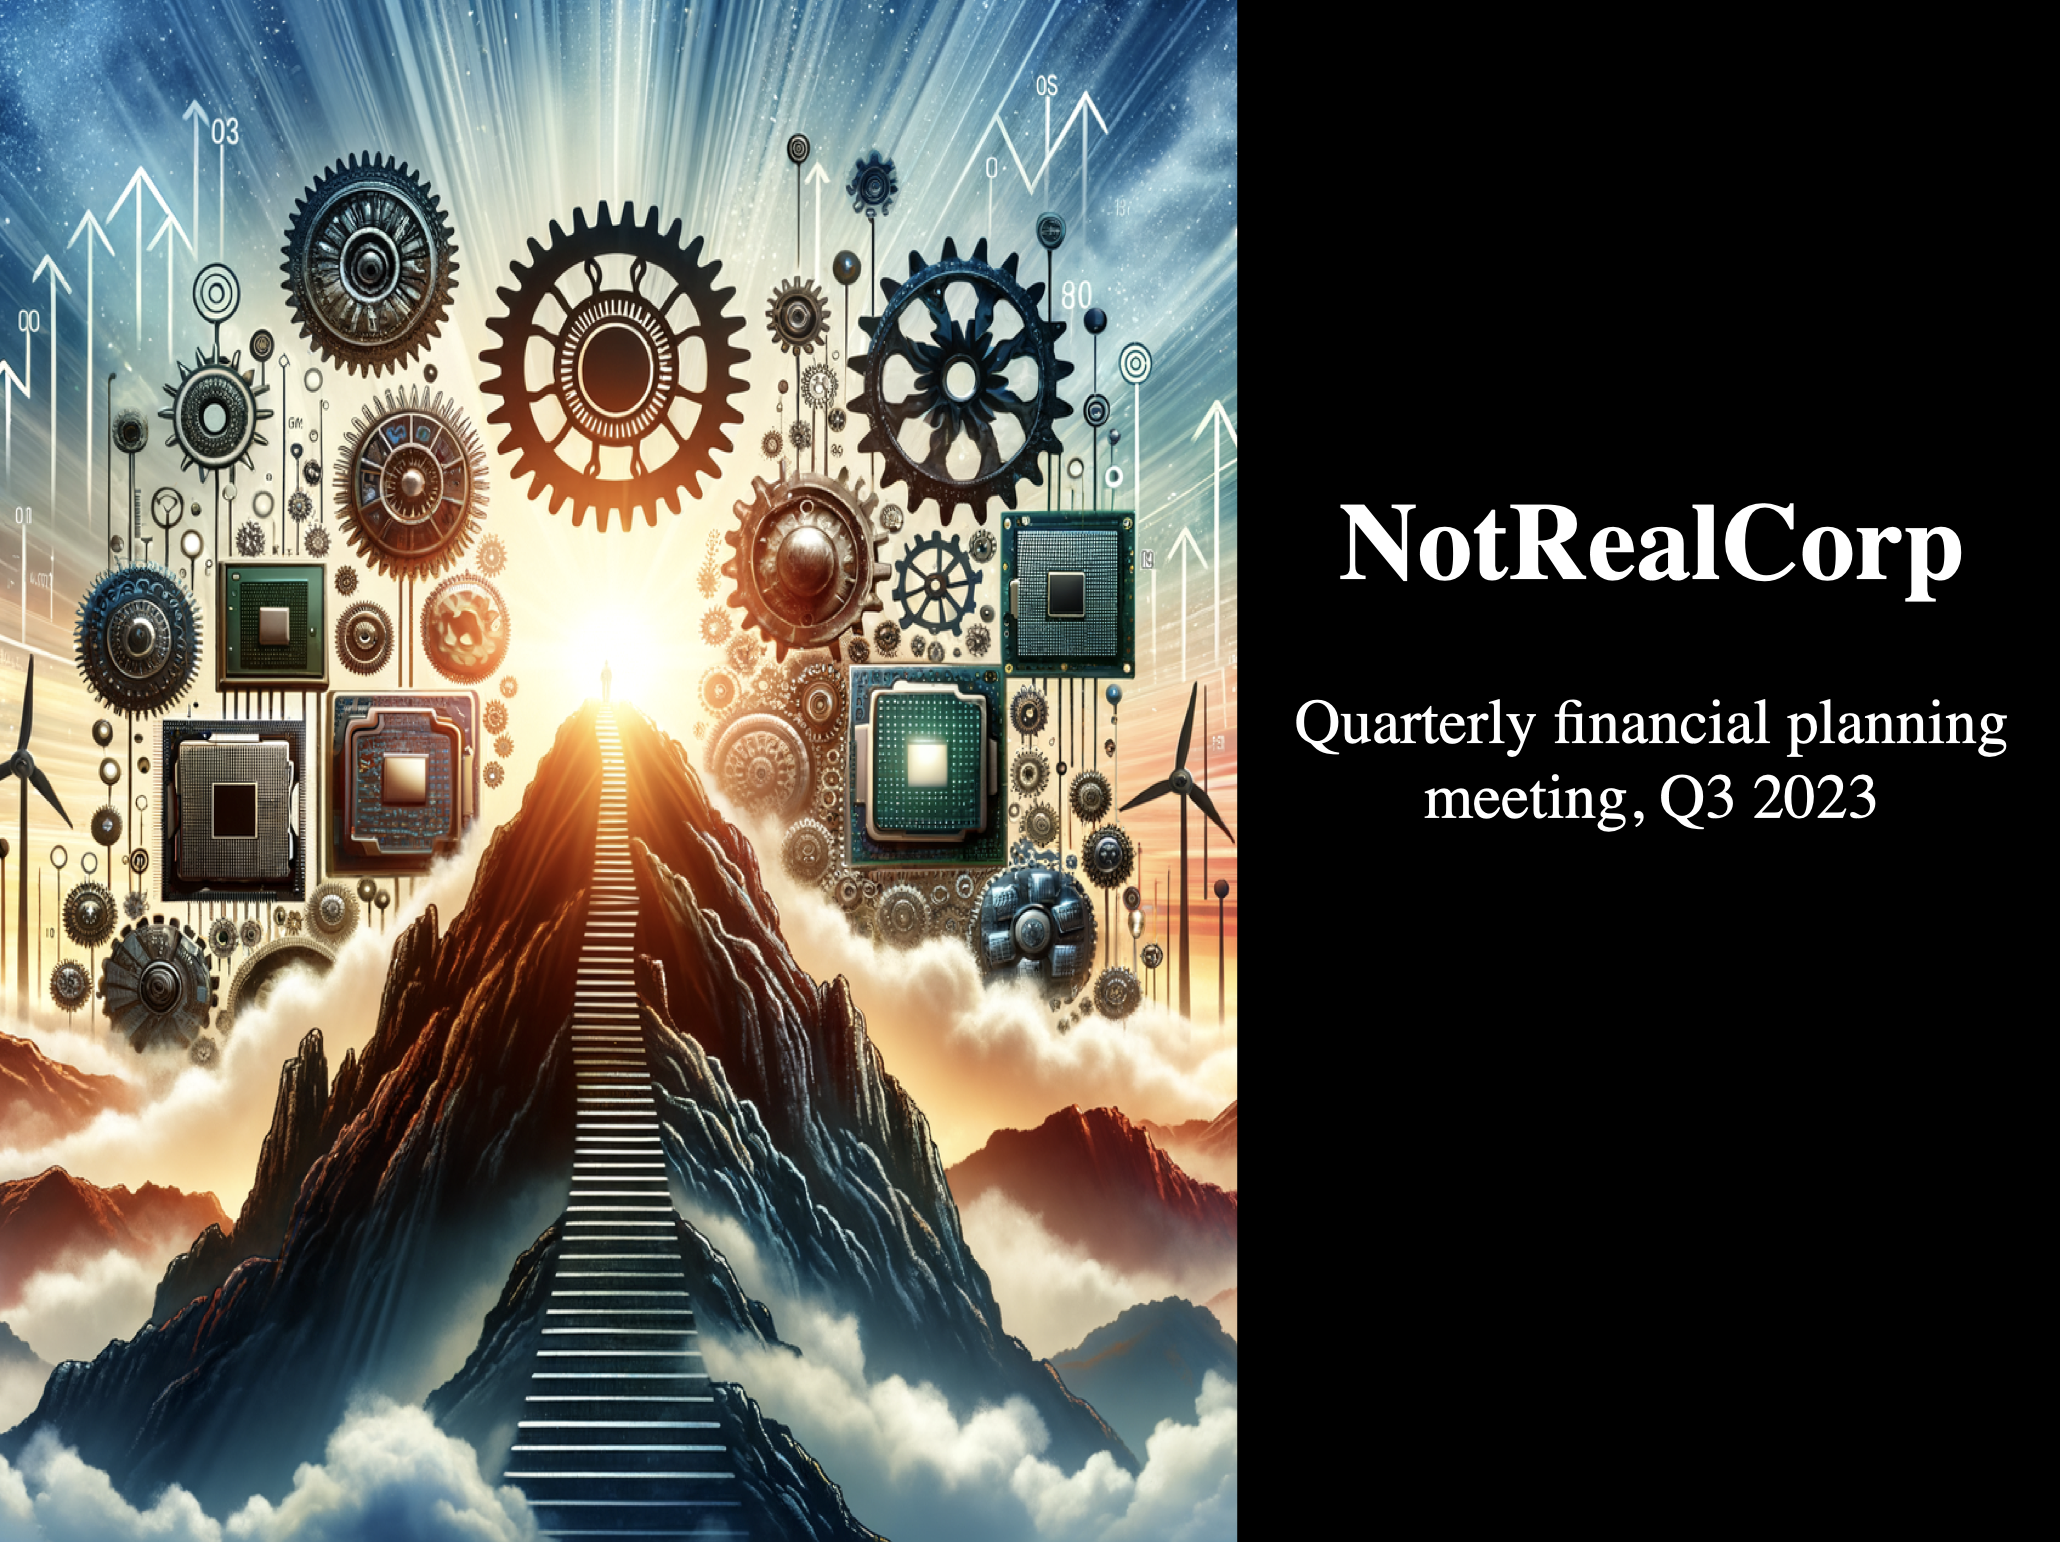
We'll feed in a brief description of our company (NotRealCorp) and have DALL·E-3 do the rest!
company_summary = "NotReal Corp is a prominent hardware company that manufactures and sells processors, graphics cards and other essential computer hardware."
response = client.images.generate(
  model='dall-e-3',
  prompt=f"given this company summary {company_summary}, create an inspirational \
    photo showing the growth and path forward. This will be used at a quarterly\
       financial planning meeting",
       size="1024x1024",
       quality="hd",
       n=1
)
image_url = response.data[0].url
Cool, now we can add this image to our thread. First, we can save the image locally, then upload it to the assistants API using the File upload endpoint. Let's also take a look at our image
dalle_img_path = '../images/dalle_image.png'
img = requests.get(image_url)

#Save locally
with open(dalle_img_path,'wb') as file:
  file.write(img.content)

#Upload
dalle_file = client.files.create(
  file=open(dalle_img_path, "rb"),
  purpose='assistants'
)

4. Creating the slides
We now have all the content we need to create the slides. While we could simply add a message asking for slides, but let's instead give the assistant a slide template, using the python-pptx library, to use. This will ensure we get a deck in the style we want. See the Extensions section at the end of the notebook for notes on creating the template.
title_template = """
from pptx import Presentation
from pptx.util import Inches, Pt
from pptx.enum.text import PP_PARAGRAPH_ALIGNMENT
from pptx.dml.color import RGBColor

# Create a new presentation object
prs = Presentation()

# Add a blank slide layout
blank_slide_layout = prs.slide_layouts[6]
slide = prs.slides.add_slide(blank_slide_layout)

# Set the background color of the slide to black
background = slide.background
fill = background.fill
fill.solid()
fill.fore_color.rgb = RGBColor(0, 0, 0)

# Add image to the left side of the slide with a margin at the top and bottom
left = Inches(0)
top = Inches(0)
height = prs.slide_height
width = prs.slide_width * 3/5
pic = slide.shapes.add_picture(image_path, left, top, width=width, height=height)

# Add title text box positioned higher
left = prs.slide_width * 3/5
top = Inches(2)
width = prs.slide_width * 2/5
height = Inches(1)
title_box = slide.shapes.add_textbox(left, top, width, height)
title_frame = title_box.text_frame
title_p = title_frame.add_paragraph()
title_p.text = title_text
title_p.font.bold = True
title_p.font.size = Pt(38)
title_p.font.color.rgb = RGBColor(255, 255, 255)
title_p.alignment = PP_PARAGRAPH_ALIGNMENT.CENTER

# Add subtitle text box
left = prs.slide_width * 3/5
top = Inches(3)
width = prs.slide_width * 2/5
height = Inches(1)
subtitle_box = slide.shapes.add_textbox(left, top, width, height)
subtitle_frame = subtitle_box.text_frame
subtitle_p = subtitle_frame.add_paragraph()
subtitle_p.text = subtitle_text
subtitle_p.font.size = Pt(22)
subtitle_p.font.color.rgb = RGBColor(255, 255, 255)
subtitle_p.alignment = PP_PARAGRAPH_ALIGNMENT.CENTER
"""

data_vis_template = """
from pptx import Presentation
from pptx.util import Inches, Pt
from pptx.enum.text import PP_PARAGRAPH_ALIGNMENT
from pptx.dml.color import RGBColor

# Create a new presentation object
prs = Presentation()

# Add a blank slide layout
blank_slide_layout = prs.slide_layouts[6]
slide = prs.slides.add_slide(blank_slide_layout)

# Set the background color of the slide to black
background = slide.background
fill = background.fill
fill.solid()
fill.fore_color.rgb = RGBColor(0, 0, 0)

# Define placeholders
image_path = data_vis_img
title_text = "Maximizing Profits: The Dominance of Online Sales & Direct Sales Optimization"
bullet_points = "• Online Sales consistently lead in profitability across quarters, indicating a strong digital market presence.\n• Direct Sales show fluctuations, suggesting variable performance and the need for targeted improvements in that channel."

# Add image placeholder on the left side of the slide
left = Inches(0.2)
top = Inches(1.8)
height = prs.slide_height - Inches(3)
width = prs.slide_width * 3/5
pic = slide.shapes.add_picture(image_path, left, top, width=width, height=height)

# Add title text spanning the whole width
left = Inches(0)
top = Inches(0)
width = prs.slide_width
height = Inches(1)
title_box = slide.shapes.add_textbox(left, top, width, height)
title_frame = title_box.text_frame
title_frame.margin_top = Inches(0.1)
title_p = title_frame.add_paragraph()
title_p.text = title_text
title_p.font.bold = True
title_p.font.size = Pt(28)
title_p.font.color.rgb = RGBColor(255, 255, 255)
title_p.alignment = PP_PARAGRAPH_ALIGNMENT.CENTER

# Add hardcoded "Key Insights" text and bullet points
left = prs.slide_width * 2/3
top = Inches(1.5)
width = prs.slide_width * 1/3
height = Inches(4.5)
insights_box = slide.shapes.add_textbox(left, top, width, height)
insights_frame = insights_box.text_frame
insights_p = insights_frame.add_paragraph()
insights_p.text = "Key Insights:"
insights_p.font.bold = True
insights_p.font.size = Pt(24)
insights_p.font.color.rgb = RGBColor(0, 128, 100)
insights_p.alignment = PP_PARAGRAPH_ALIGNMENT.LEFT
insights_frame.add_paragraph()


bullet_p = insights_frame.add_paragraph()
bullet_p.text = bullet_points
bullet_p.font.size = Pt(12)
bullet_p.font.color.rgb = RGBColor(255, 255, 255)
bullet_p.line_spacing = 1.5
"""
Let's set a few quick variables for our slides. We want the company name, NotRealCorp, to be on the title slide, and the title of the presentation should 'Quartlerly financial planning metting, Q3, 2023'.
title_text = "NotRealCorp"
subtitle_text = "Quarterly financial planning meeting, Q3 2023"
And for the data slide, we have:
Here we have a template to create a Title Slide. The template below was created by uploading the image of a desirable title slide to GPT-V, and asking for the python-pptx code to create that template. The inputs to the template are the image_path, title_text, and subtitle_text.
submit_message(assistant.id,thread,f"Use the included code template to create a PPTX slide that follows the template format, but uses the image, company name/title, and document name/subtitle included:\
{title_template}. IMPORTANT: Use the image file included in this message as the image_path image in this first slide, and use the Company Name {title_text} as the title_text variable, and \
  use the subtitle_text {subtitle_text} a the subtitle_text variable. \
    NEST, create a SECOND slide using the following code template: {data_vis_template} to create a PPTX slide that follows the template format, but uses the company name/title, and document name/subtitle included:\
{data_vis_template}. IMPORTANT: Use the line plot image, that is the second attached image in this message, that you created earlier in the thread as the data_vis_img image, and use the data visualization title that you created earlier for the variable title_text, and\
  the bullet points of insights you created earlier for the bullet_points variable. Output these TWO SLIDES as a .pptx file. Make sure the output is two slides, with each slide matching the respective template given in this message.",
              file_ids=[dalle_file.id, plot_file.id]
)
Run(id='run_taLrnOnlDhoywgQFFBOLPlg0', assistant_id='asst_3T362kLlTyAq0FUnkvjjQczO', cancelled_at=None, completed_at=None, created_at=1701827118, expires_at=1701827718, failed_at=None, file_ids=['file-piTokyHGllwGITzIpoG8dok3'], instructions='You are a data scientist assistant. When given data and a query, write the proper code and create the proper visualization', last_error=None, metadata={}, model='gpt-4-1106-preview', object='thread.run', required_action=None, started_at=None, status='queued', thread_id='thread_73TgtFoJMlEJvb13ngjTnAo3', tools=[ToolAssistantToolsCode(type='code_interpreter')])#May take 1-3 mins
while True:
try:
response = get_response(thread)
pptx_id = response.data[0].content[0].text.annotations[0].file_path.file_id
print("Successfully retrieved pptx_id:", pptx_id)
break
except Exception as e:
print("Assistant still working on PPTX...")
time.sleep(10)
Assistant still working on PPTX...
Assistant still working on PPTX...
Assistant still working on PPTX...
Assistant still working on PPTX...
Assistant still working on PPTX...
Assistant still working on PPTX...
Assistant still working on PPTX...
Assistant still working on PPTX...
Assistant still working on PPTX...
Assistant still working on PPTX...
Successfully retrieved pptx_id: file-oa0i63qPH4IaJXYj90aA6L4Q
pptx_id = response.data[0].content[0].text.annotations[0].file_path.file_id
ppt_file= client.files.content(pptx_id)
file_obj = io.BytesIO(ppt_file.read())
with open("data/created_slides.pptx", "wb") as f:
    f.write(file_obj.getbuffer())
Now, we have a PPTX file saved with all of our created content!.
Let's look at the screenshots of the .pptx we just created using JUST the assistants API and DALL·E-3. We don't have a seed parameter yet in the Assistants API, so the DALL·E-3 image and wordings will be slightly different from what you see when you run this notebook, due to the non-determinism of LLMs, but the outputs should be directionally the same.
The title slide:
And the data slide:
5. Conclusion
Woo! While these slides could use some formatting tweaks, we have made some great content using the Assistants API, GPT-4 and DALL·E-3. We were able to take a .csv file with financial data, and use our assisant to calculate profit by quarter across distribution channels, plot the results, identify insights and key takeaways from the visualization, and create a summarative title. And, given just a description of our company, NotRealCorp, we used DALL·E-3 to make an awesome title image.
While we are still a ways away from entirely automating this process without a human in the loop, hopefully this notebook can make the slide creation process a bit easier for you. More importantly, this notebook can ideally give you a glimpse into the potential of the assistants API! We're excited to see what you build.
6. Extensions
- When DALL·E-3 is incorporated in the Assistants API, we will have the ability to request the generated title image within the thread.
- GPT-4-Vision is not yet supported in the Assistants API, but could have been used to gather insights from the line plot image.
- GPT-4-Vision was used to generate the
python-pptxtemplate included in this recipe, so a potential extension project could be demonstrating best practices around converting images to slide templates.