Overview
The best model for you depends on your business goal. Many startups choose large language models (LLMs) based on offline evaluations and public benchmarks. However, a model that achieves high scores on a benchmark may not necessarily lead your users to pay, subscribe, or continue using your product. Models that look strong on paper can underperform when measured against actual business outcomes.
This guide describes an evaluation approach grounded in one of the most important business outcomes for startups: whether people are willing to pay for your product.
We’ll walk through HyperWrite’s model evaluation process, with a focus on real payment conversion—specifically Stripe payments for one-time purchases or monthly recurring revenue (MRR) subscriptions. If your goal is to improve conversion rates, or to maintain them while switching to a less expensive model, this evaluation example may be a useful pattern to follow.
Prerequisites and scope
To apply this guide to your business, you’ll need:
- A payment processor. We use Stripe in this example, but you can make slight adjustments and use the same approach with any payment provider.
- Enough users to yield a meaningful signal. Aim for at least one thousand users per test variant. For higher statistical significance, you’ll need more users.
- An AI-powered product with a conversion event. We use an LLM application, and our conversion event is payment. The same testing approach applies to apps built around voice, video, and other modalities.
Model selection based on your actual goal
HyperWrite builds AI-powered writing tools and research assistants. The company’s core offering is a writing assistant with advanced research capabilities.
Offline benchmarks did not predict what mattered most for HyperWrite: whether users engaged with the writing assistant in a way that led them to subscribe and continue using the product. The HyperWrite team shifted to focusing on the outcome of interest—conversion—and began selecting between AI models based on real-world A/B tests comparing Stripe conversion rates.
What moves the needle for startups: conversion
At many startups, having users sign up for and continue to use the product is the goal. Using classic A/B testing, using the same statistical methods scientists have relied on for decades, you can design a model evaluation process:
- New users are batched, and each batch is served a different AI model.
- To standardize when users encounter an upgrade prompt, a consistent rate limit is applied after users have sent the assistant a set number of messages—enough to create a meaningful upgrade moment.
- Conversion to a paid subscription (via Stripe) is tracked for each group.
Random assignment of users to models and control of other factors (onboarding, features, prompts, etc.) allows attribution of differences in conversion rates to the models being tested, rather than to external variation. Statistics provide confidence that observed differences are unlikely to be due to chance.
When a true, non-random improvement is found (e.g., one model yields a higher conversion rate), the impact is tangible: higher Stripe conversions, more paying users, and often lower costs if the model is more efficient.
How to A/B test to choose a model
A/B testing can serve as a real-world evaluation tool for model selection. Randomly split users into groups, give each group a different experience (here, a different AI model), and observe which group performs better on the key metric—in this case, Stripe conversions.
The basics: one model vs. another
A standard setup includes a “control” (your current model) and a “variant” (a challenger). Users are randomly assigned to either group. To ensure the test isolates the model’s effect, everything else is kept the same: onboarding, features, prompts, and the opportunity to convert. After a predetermined period or number of users, conversion rates are compared: did more people pay when using Model A or Model B?
Real-world example: HyperWrite’s model swap test
HyperWrite’s goal was to deploy a less expensive LLM without materially reducing monetization. This was a non-inferiority scenario: the interest was in ensuring the new model was not significantly worse than the control. With cost savings in mind, a one-sided non-inferiority test was designed.
- Test focus: Cost savings without harming Stripe conversion.
- Design: One-tailed, two-proportion Z-test (focused on detecting whether the new model is worse).
- Alpha (Type I error rate): 0.15 (i.e., 85% confidence). For this startup, iteration speed was prioritized over very strict significance thresholds.
- Power: 0.60 (sufficient to catch meaningful drops, balanced against traffic constraints).
- Minimum detectable effect (MDE): A 30% drop in conversion—any decline less than this would be considered “close enough” if the cost savings justified it.
- Population: A segment of new sign-ups over a defined period, randomized by
user_idat signup. - Trigger: Users send messages, hit an upgrade paywall, and may convert via Stripe checkout.
Setting your parameters: What counts as winning?
Not every observed difference will be meaningful—some differences occur by chance. A/B testing helps separate real effects from random noise. The commonly used statistical tool here is the “two-proportion Z-test,” which checks whether the difference in conversion rates between two groups is large enough to be considered statistically significant.
There are a few variations of this test:
- One-tailed test: Checks if the new model is better than (or, depending on design, not worse than) the control
- Two-tailed test: Checks for any difference, whether up or down
- Multivariate tests (A/B/n): Three or more models are compared simultaneously
The choice depends on your goal. If you require a clear upgrade in conversion, a one-tailed test looking for improvement may suffice. If you’re willing to adopt a model that is no worse but cheaper, you may design a non-inferiority (one-sided) test to ensure the new model is not significantly worse.
Key terms
- Type I Error (False Positive): Concluding there is an effect when there is none
- Type II Error (False Negative): Failing to detect a real effect
- Alpha (α): The acceptable risk of a Type I error (often set at 0.05, i.e., 5%)
- Power: The probability of detecting a true effect (80% is a common target)
Example: Running a Real Model Test
Consider choosing between your current model (Control) and a new variant (Model X). Suppose you run a one-tailed two-proportion Z-test to see if Model X converts better than the Control. You set α = 0.05 and, after doing a power calculation with your baseline conversion rate and desired minimum detectable effect, determine that roughly 1,500 users per group will provide ~75% power—a compromise allowing for faster directional insight.
After both groups reach the required sample size, the data might look like:
| Group | Users Assigned | Conversions | Conversion Rate | p-value | Stat. Significant? | Winner? | Type I Error Guarded? | Type II Error Guarded? |
|---|---|---|---|---|---|---|---|---|
| Control (Current Model) | 1500 | 15 | 1.0% | -- | Reference | No | Yes | Yes |
| Model X (Variant) | 1500 | 30 | 2.0% | 0.012 | Yes | Yes | Yes | Yes |
- Users Assigned: Number of users randomly placed in each group.
- Conversions: How many paid via Stripe in each group.
- Conversion Rate: Conversions divided by users assigned.
- p-value: Result of the one-tailed two-proportion Z-test, showing if Model X’s higher rate is likely not due to chance.
- Stat. Significant?: Does the p-value beat your alpha (here, 0.05)?
- Winner?: If statistically significant, Model X is the new winner.
- Type I Error Guarded?: Did we keep the false positive risk within our alpha threshold?
- Type II Error Guarded?: Did our sample size give us enough power to detect a real effect?
In this run, Model X’s conversion rate is 1 percentage point higher than the control (2.0% vs. 1.0%)—a 100% relative increase. The p-value of 0.012 is well below 0.05, so we mark it as statistically significant: Model X is the winner. Because we planned the sample size for 75% statistical power, we’re also confident we didn’t miss a true effect (Type II error). And since we set our alpha at 0.05, the risk of a false positive (Type I error) is controlled.
Real-world example: HyperWrite’s test parameters
HyperWrite did not default to the textbook 95% confidence and 80% power. Traffic is expensive, and maximizing statistical certainty can slow learning and consume capital. The chosen 85% confidence and 60% power allowed detection of any material drop (about a 30% decrease) while avoiding over-optimizing for small differences.
Conversion rates tend to rise as a test runs longer. In these tests, runs were stopped once the required sample size (N) was reached. Only a fraction of incoming traffic was allocated to each test arm, with the majority remaining on the proven control experience.
Multiplicity and comparison note
An A/B/n (“many-vs-one”) design was used: each candidate model (GPT-4.1 and GPT-4.1-mini) was evaluated against the production control (Claude 3.5 Sonnet) but not directly against each other.
Because the launch decision was variant-specific (“ship the arm if its own one-tailed non-inferiority test at α = 0.15 passes; otherwise discard”), a family-wise error rate correction was not applied. This is standard for small-k, control-centric tests. The false positive risk applies only to the single arm launched, and avoiding Bonferroni-type splits preserves power.
How to check A/B test significance in Python
To demonstrate exactly how the statistics behind our A/B test work, here’s a 10-line Python snippet that converts raw conversion counts into a p-value using a one-tailed two-proportion Z-test (variant better than control). Paste it into any Python REPL, Colab, or notebook and swap in your own numbers when you run real experiments.
# One-tailed two-proportion Z-test
from statsmodels.stats.proportion import proportions_ztest

conversions   = [30, 15]     # [variant, control]
sample_sizes  = [1500, 1500] # [variant, control]

z_stat, p_val = proportions_ztest(
    conversions,
    sample_sizes,
    alternative="larger"      # "larger" → variant > control
)

print(f"Z-statistic = {z_stat:.2f}")
print(f"p-value     = {p_val:.3f}")    # → 0.012 (α = 0.05)
How to read the results:
- If the p-value is ≤ 0.05, your variant’s higher conversion is statistically significant—go ahead and ship it, or keep monitoring for more data.
- If it’s > 0.05, the result could be random noise—collect more data, or stick with your control.
Cautions
- Tail fishing / p-hacking: Decide one- vs two-tailed before the first user flows in; switching later inflates your Type I error (false positives).
- Low counts: If either arm has < ~10 conversions, swap the Z-test for Fisher’s exact test or Wilson/Wald CIs.
- Early peeking: Repeated looks at the data without α-spending corrections raise false-positive risk. Use a fixed sample or a group-sequential design.
- User overlap / contamination: Make sure the same user ID can’t land in two arms (e.g., via logout/login).
- Multiple challengers: If you plan to pick the single “best” of many variants, control family-wise error (Bonferroni, Holm) or use a multi-armed bandit.
- Caching & prompt drift: Confirm your inference layer doesn’t leak one model’s response into another’s cache; keep prompts identical across arms.
To learn more about these pitfalls and how they are avoided, check out Evan Miller's "How Not to Run an A/B Test"
The big takeaway
A/B testing isn’t just for landing pages or button colors—it’s essential for picking the right LLM for your product. By making it part of your workflow, you’ll dodge costly mistakes and spot upgrades grounded in what your users value: a product worth paying for.
Real-world example: HyperWrite’s cost savings with GPT-4.1
Model pricing often increases as capabilities improve. HyperWrite spent several months looking for a model that could match its incumbent (Anthropic’s Claude 3.5 Sonnet) without harming conversion or user experience, ideally at a lower cost. After several models performed worse, OpenAI’s GPT-4.1 provided a notable result: matching the incumbent’s Stripe conversion at a lower price.
Here’s how the variants stacked up on Stripe conversion:
| Variant | Assigned | Conversions | Rate | Req N | % Done | Conv cut-off (≤) | Worse? |
|---|---|---|---|---|---|---|---|
| anthropic/claude-3.5-sonnet (control) | 4550 | 42 | 0.92% | 3378 | 135% | — | — |
| openai/gpt-4.1 (variant) | 4513 | 58 | 1.29% | 3378 | 134% | 32 | No |
| openai/gpt-4.1-mini (variant) | 4557 | 45 | 0.99% | 3378 | 135% | 33 | No |
- Variant: Model name (control or challenger).
- Assigned: Number of users randomly placed in that arm.
- Conversions: Users in the arm who paid via Stripe.
- Rate: Conversions divided by Assigned.
- Req N: Pre-computed sample-size target for the non-inferiority test.
- % Done: Assigned divided by Req N (progress toward the target).
- Conv cut-off (≤): Maximum conversions below which the arm would be flagged “significantly worse” than control.
- Worse?: “Yes” if the arm fell below its cut-off (i.e., statistically worse); otherwise “No”.
Results
- Both GPT-4.1 variants beat their cut-offs—meaning neither was statistically worse than the control.
- GPT-4.1 (full) held its own on conversion rate against Claude 3.5 Sonnet, while delivering substantial cost savings.
Measuring conversion takes some creativity and data
To perform this analysis, you need a system that links user behavior to Stripe payment events. There’s no universal template for this, but the architecture used at HyperWrite illustrates one way to implement it. This workflow can be adapted for any startup where users interact with an AI and can upgrade via Stripe.
- User Tracking: Assign a unique identifier to each new signup that persists through their lifecycle.
- Model Assignment: Randomly assign each user to a test group (model variant) at signup, and store this assignment in your database.
- Interaction Logging: Log key events (e.g., first use, rate limit reached) along with user IDs and model assignments.
- Conversion Event Capture: Set up a Stripe webhook to listen for
checkout.session.completedevents. When triggered, match the Stripe customer to your internal user ID and update your database to reflect payment/conversion. - Data Aggregation: Regularly pull test group assignments and conversion data into a single table or dashboard for analysis.
- Statistical Testing: Use a basic Z-test (many libraries/Excel templates exist) to analyze whether the conversion rate differences are meaningful.
The following sequence diagram outlines the process:
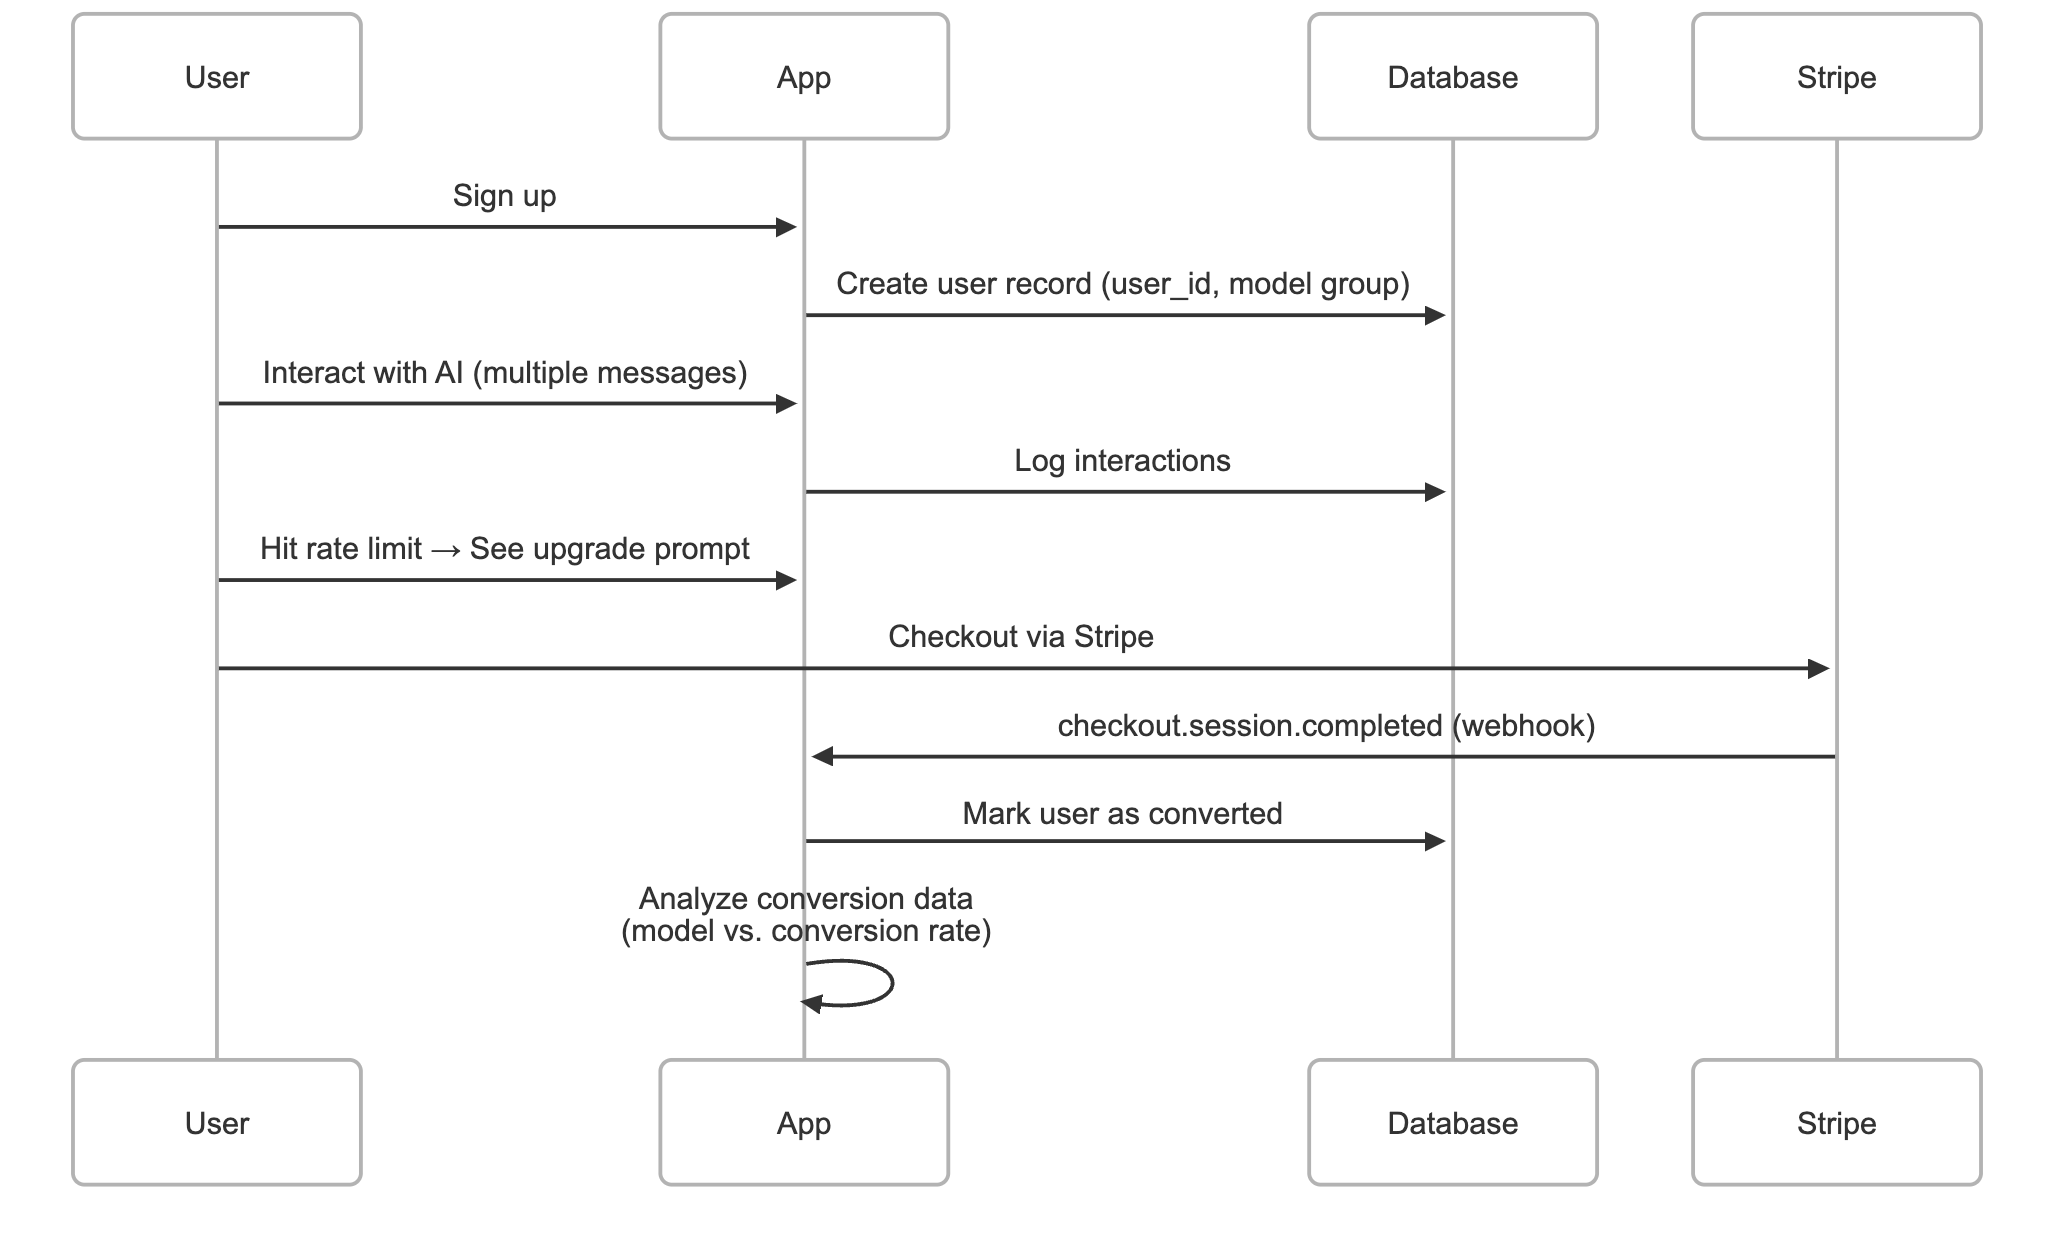
User workflow
Here’s what a user journey looks like at HyperWrite:
- User signs up: When a user creates an account, their information is stored in the database and a unique
user_idis assigned. - First message sent: The new user interacts with the writing assistant for the first time.
- Rate limit triggers: After a set number of messages, a rate limit is reached. This introduces a consistent point where an upgrade prompt can be shown.
- Conversion opportunity: Some users opt to subscribe at this point—they are directed to Stripe checkout.
Stripe workflow
We care about two key Stripe actions:
- Stripe event listening: The system listens for the
checkout.session.completedevent from Stripe’s webhook, which fires when a payment succeeds. - Database update: When the webhook is received, the corresponding
user_idis marked as converted in the database.
Running the test
Routinely check to see if the test is done:
- Query test groups: Retrieve all users assigned to each model variant.
- Join Stripe data: Merge your user data with Stripe subscription events, so you know exactly which users in each group converted.
- Run stats: Use a one-tailed two-proportion Z-test (see the previous section) to check if the difference in conversion rates is statistically meaningful.
Conclusion and next steps
A primary lesson from this approach is that real-world testing tied to business metrics (such as Stripe conversions) can reveal which model choices actually drive results for your product. While offline benchmarks and lab tests have their place, connecting evaluation to the moment a user decides to pay often leads to decisions that benefit both customers and the business.
What This Means for Startups
Beating your incumbent model is not always necessary; a model that performs “as well” on your key metric at a lower cost can be valuable. In this case, OpenAI’s GPT-4.1 matched the incumbent’s Stripe conversion rate while reducing cost.
This underscores the value of tying model evaluation to Stripe-driven A/B tests—you gain clear, revenue-linked answers rather than relying solely on benchmarks or subjective impressions.
Startups can extend this testing in several directions:
- Segment by persona or use case: Divide your audience (e.g., power users vs. newcomers, different industries) and see which models or prompts perform best for each group.
- Find the revenue–cost sweet spot: Consider not only top-line revenue but also the cost to serve each model. The optimal choice may balance profit rather than maximize sales alone.
- Monitor long-term impact: Look beyond immediate conversions. Track metrics like subscriber lifetime value, churn, or retention to optimize for sustainable growth.
There’s a lot of room to get creative with what you measure and how you experiment, so you can tune your product for what matters most to your team.
For questions about this type of testing, feedback on your approach, or input on setting up your own test, feel free to reach out: josh@othersideai.com.
Here’s to building, experimenting, and letting your users—and your Stripe dashboard—guide the way.
Contributors
This cookbook was contributed by Josh Bickett, Lead Engineer at HyperWrite, a company building AI-powered writing tools and research assistants. The methods and case studies reflect HyperWrite's experience but are intended as a general guide for startups evaluating LLMs using payment conversion metrics.